IC Markets Home Sign in Web Trader Contact Us
IC Markets Social IC Markets Social

Information Hub for
Serious Traders

  • ABOUT US
  • OPEN LIVE ACCOUNT
  • OPEN DEMO ACCOUNT
  • TRADE NOW
  • VISIT OUR BLOG
IC Markets Social
  • ABOUT US
  • OPEN LIVE ACCOUNT
  • OPEN DEMO ACCOUNT
  • TRADE NOW
  • VISIT OUR BLOG
January 12, 2023European_Indexes_esIC Markets

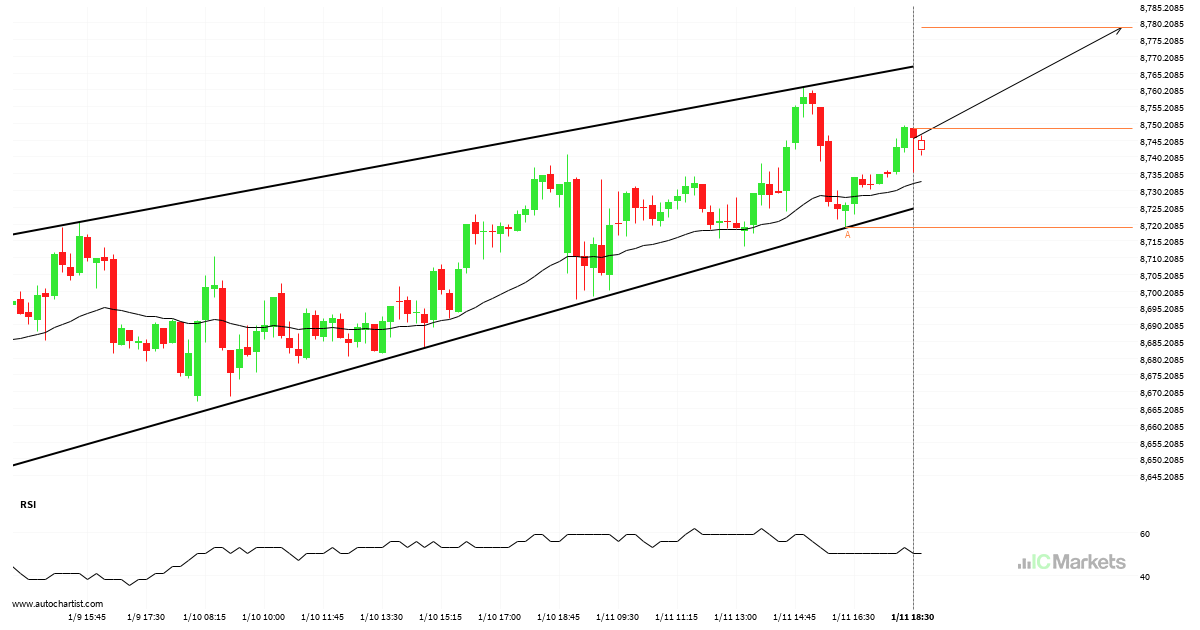
Inminente recuperación o irrupción del Spain 35 Index

El Spain 35 Index se dirige a la línea de resistencia de un Cuña ascendente. Si este movimiento se mantiene, el precio de Spain 35 Index podría probar el nivel de 8778.6898 en las próximas 7 horas. Ya ha probado esta línea en numerosas ocasiones, por lo que este movimiento podría durar poco y terminar […]

Read more
January 10, 2023European_Indexes_esIC Markets

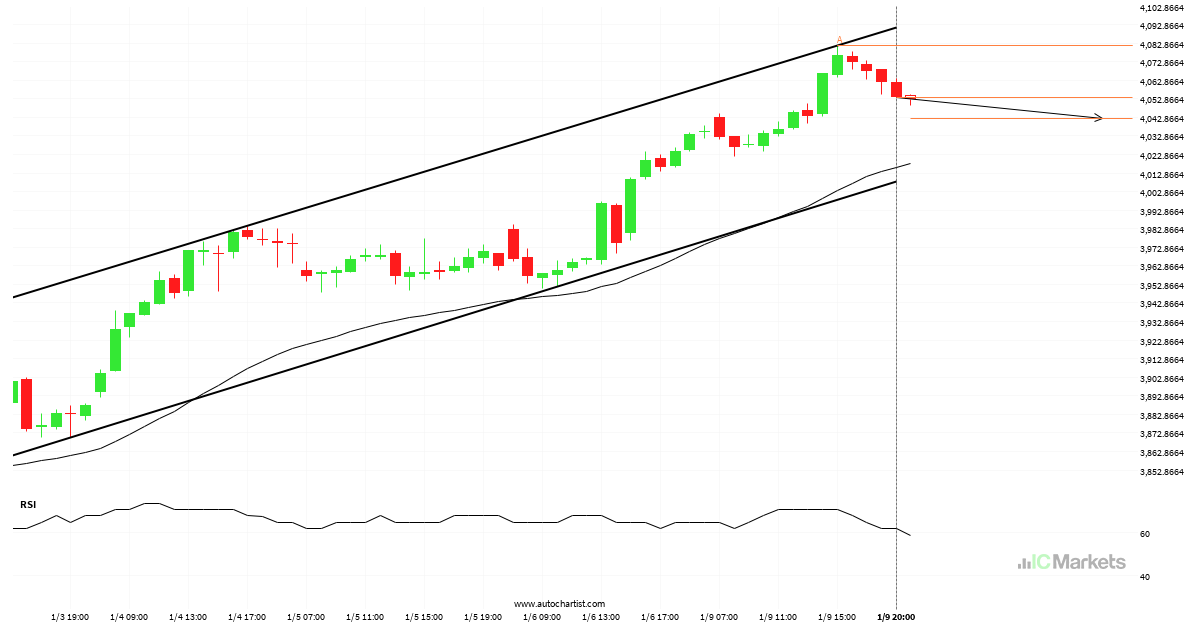
EU Stocks 50 Index – acercándose a el soporte del Canal alcista

El EU Stocks 50 Index avanza hacia una línea de soporte. Como le hemos visto retroceder desde esta línea anteriormente, podríamos presenciar, o bien, una ruptura a través de esta línea o una recuperación a los niveles actuales. Ha llegado a esta línea en numerosas ocasiones en los últimos 7 días y puede probarla de […]

Read more
January 9, 2023European_Indexes_esIC Markets

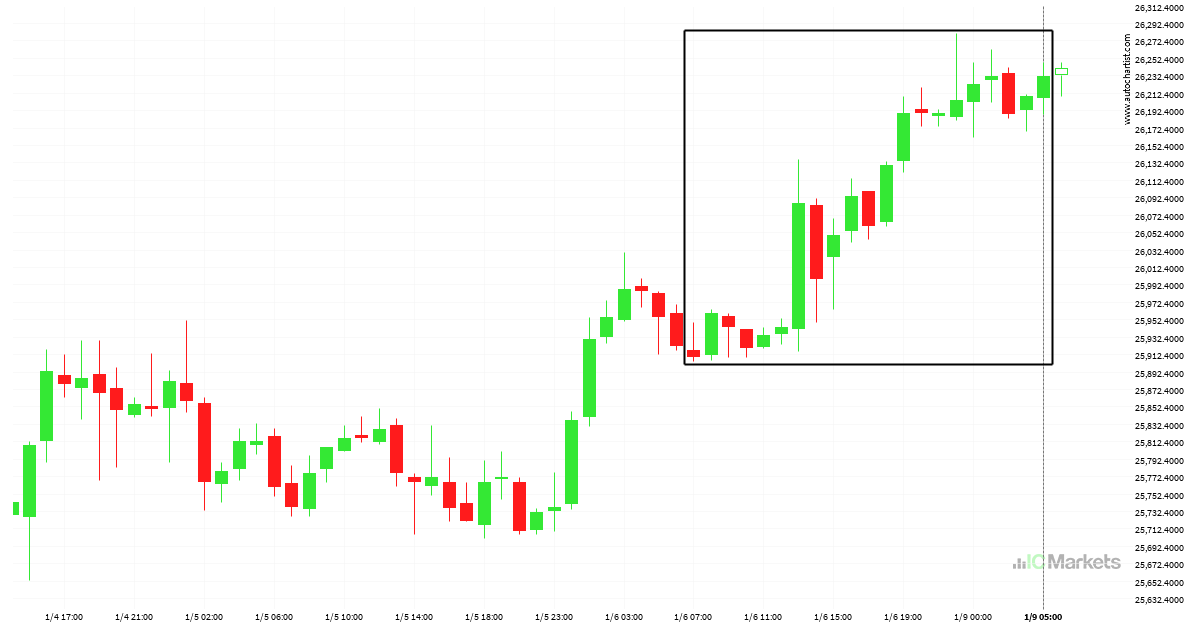
Extraordinario movimiento alcista del Japan 225 Index

El Japan 225 Index ha ascendido un 1,24% de 25909.0 a 26231.0 en 3 días.

Read more
January 6, 2023European_Indexes_esIC Markets

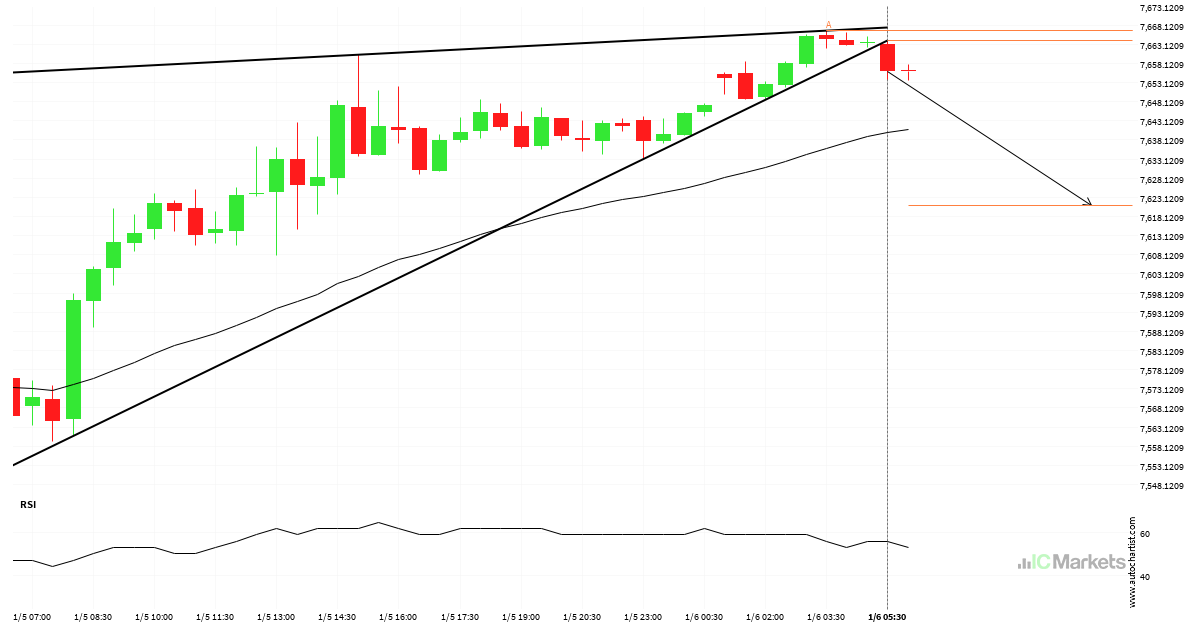
Un posible comienzo de una tendencia bajista en el UK 100 Index

El UK 100 Index ha atravesado una línea de soporte de un patrón de gráfico que corresponde a un Cuña ascendente. Si esta irrupción se mantiene, podríamos ver el precio del UK 100 Index probando el nivel de 7620.8852 dentro de las próximas 6 horas. Pero no se apresure si desea operar, porque ya ha […]

Read more
January 5, 2023European_Indexes_esIC Markets

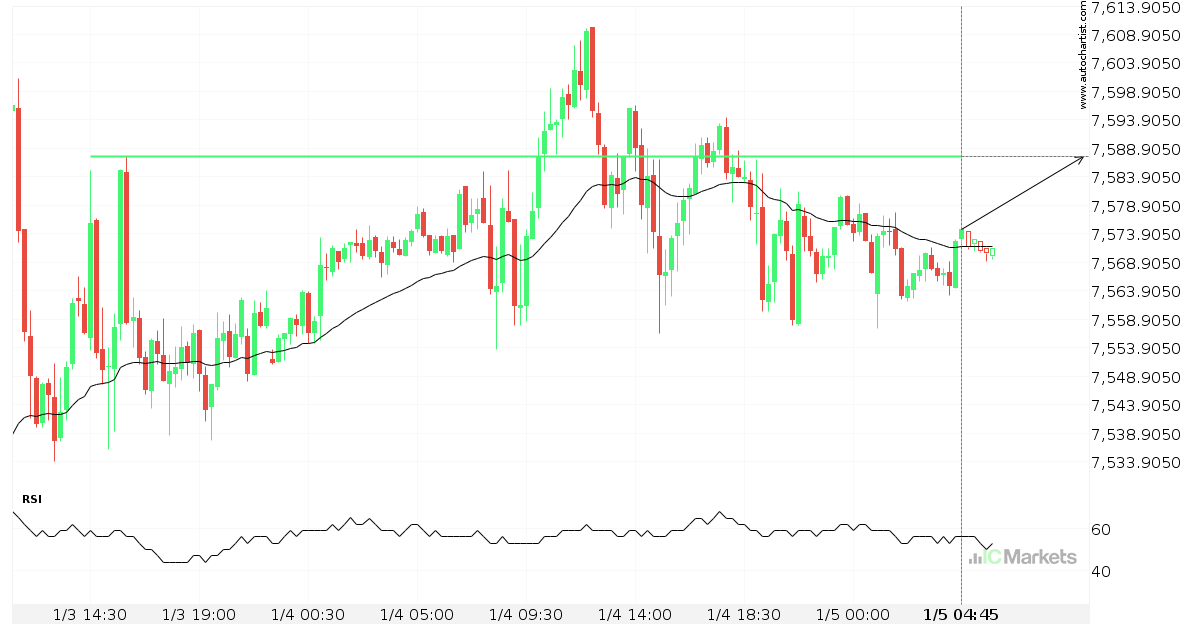
O bien, una inminente recuperación o una ruptura del UK 100 Index

El UK 100 Index avanza hacia la línea de 7587.5000. Si este movimiento se mantiene, el precio del UK 100 Index podría probar el nivel de 7587.5000 en un plazo de 8 horas. Pero no se apresure a la hora de operar, porque el par ha probado esta línea en numerosas ocasiones durante el pasado, […]

Read more
January 4, 2023European_Indexes_esIC Markets

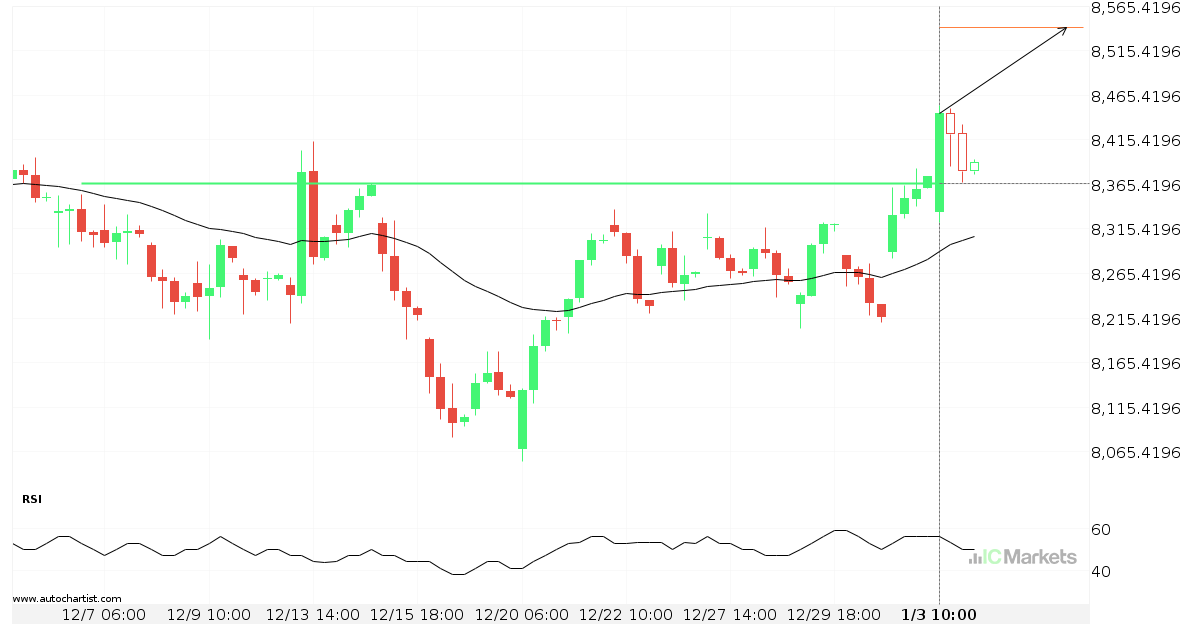
Spain 35 Index – línea de precio psicológico atravesada

El Spain 35 Index atravesó la línea de resistencia. Como ya lo hemos visto retroceder desde esta posición en el pasado, deberíamos esperar la confirmación de la ruptura antes de operar. Ha llegado a esta línea en numerosas ocasiones en los últimos 28 días, lo cual sugiere un posible nivel objetivo alrededor de 8541.0996 dentro […]

Read more
January 3, 2023European_Indexes_esIC Markets

Japan 225 Index – acercándose a el soporte del Cuña descendente

El Japan 225 Index avanza hacia una línea de soporte. Como le hemos visto retroceder desde esta línea anteriormente, podríamos presenciar, o bien, una ruptura a través de esta línea o una recuperación a los niveles actuales. Ha llegado a esta línea en numerosas ocasiones en los últimos 30 días y puede probarla de nuevo […]

Read more
January 2, 2023European_Indexes_esIC Markets

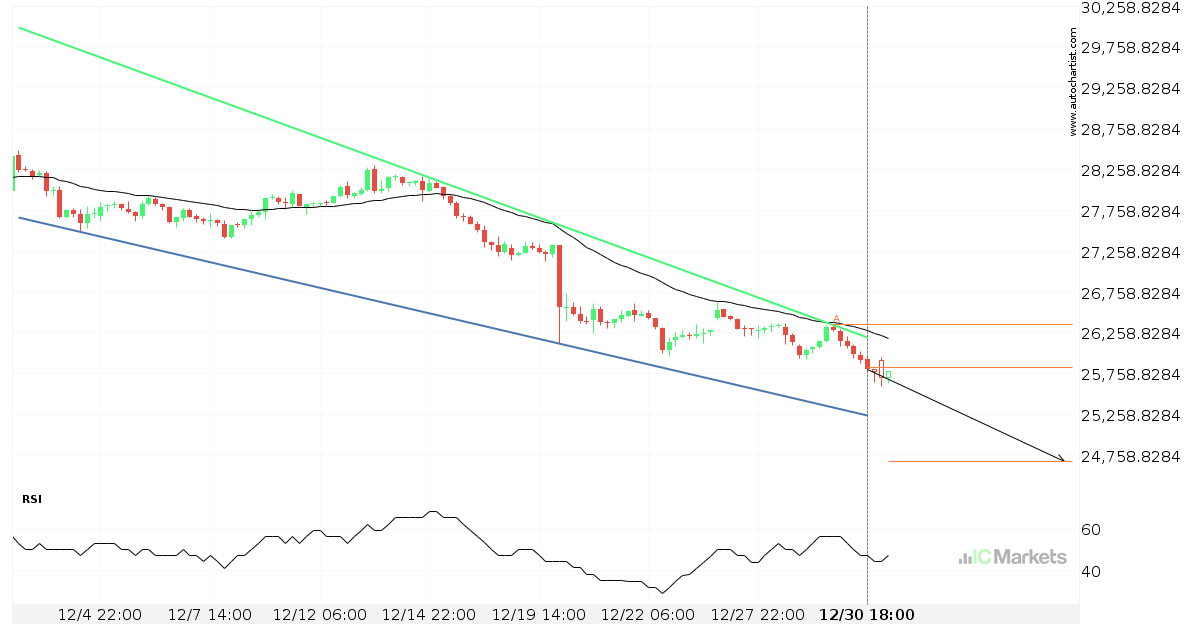
Un posible comienzo de una tendencia bajista en el France 40 Index

El France 40 Index ha atravesado una línea de soporte de un patrón de gráfico que corresponde a un Triángulo. Si esta irrupción se mantiene, podríamos ver el precio del France 40 Index probando el nivel de 6403.6631 dentro de las próximas 2 días. Pero no se apresure si desea operar, porque ya ha probado […]

Read more
December 30, 2022European_Indexes_esIC Markets

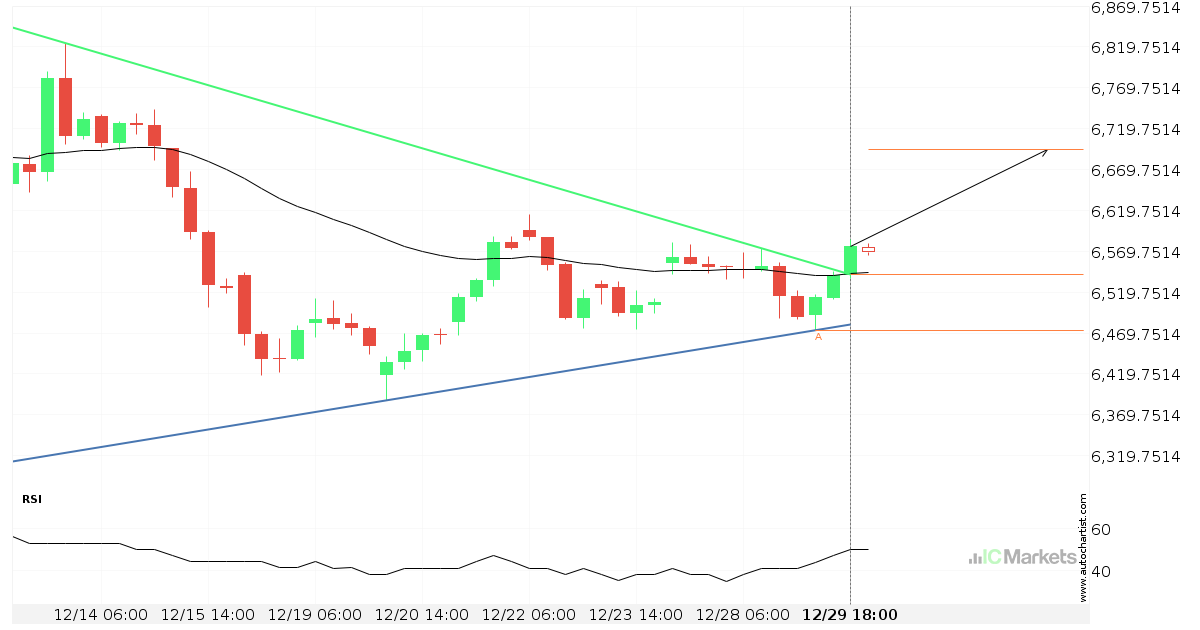
Un posible comienzo de una tendencia alcista en el France 40 Index

El France 40 Index ha atravesado una línea de resistencia de un patrón de gráfico que corresponde a un Triángulo. Si esta irrupción se mantiene, podríamos ver el precio del France 40 Index probando el nivel de 6694.4464 dentro de las próximas 3 días. Pero no se apresure si desea operar, porque ya ha probado […]

Read more
December 29, 2022European_Indexes_esIC Markets

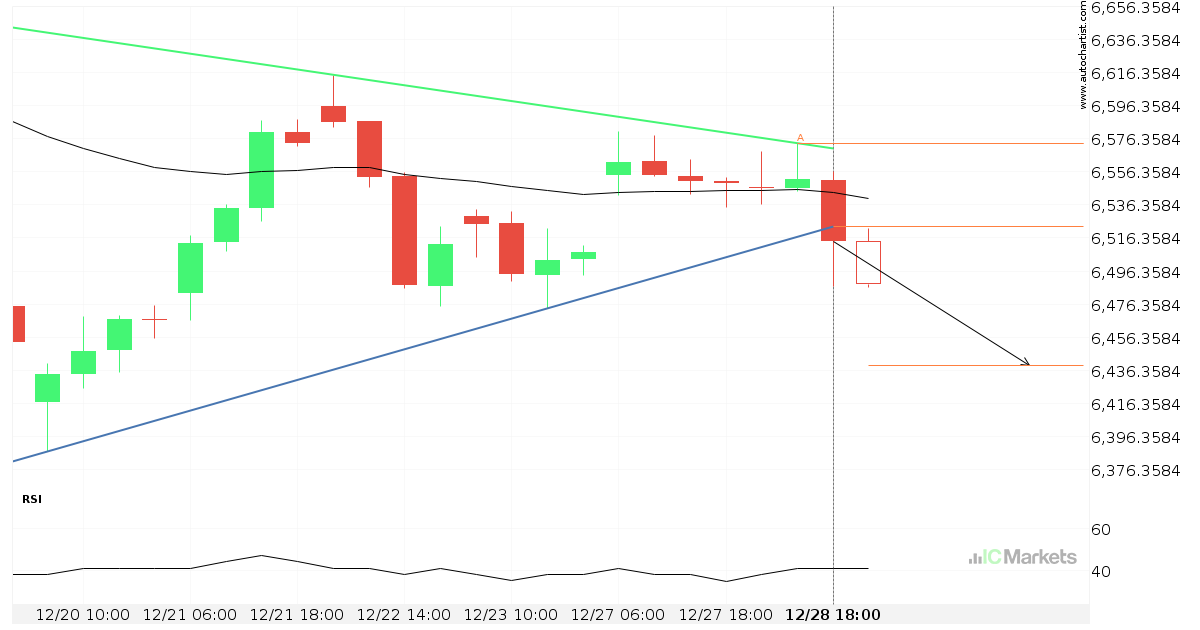
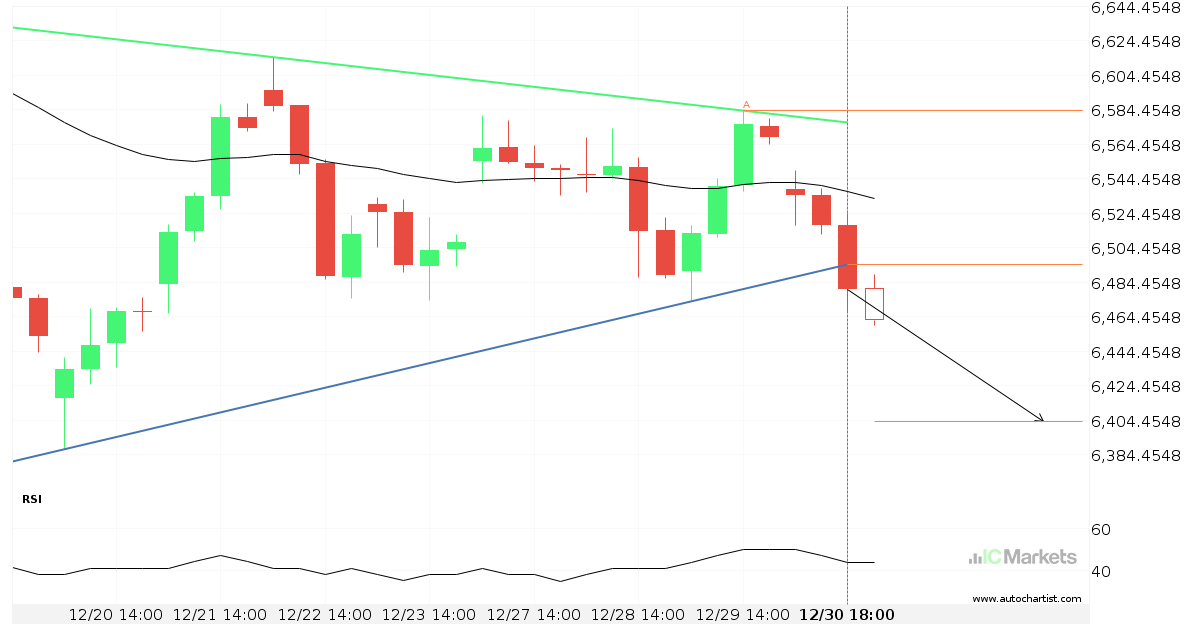
France 40 Index – ha irrumpido la línea de soporte

El France 40 Index ha atravesado la línea de soporte de un patrón de gráfico técnico con un Triángulo. Como le hemos visto retroceder desde esta posición en el pasado, deberíamos esperar la confirmación de la ruptura antes de actuar. Ha llegado a esta línea dos veces en los últimos 10 días y sugiere un […]

Read more
  • 1
  • 2
  • 3
  • …
  • 39
  • 40
  • 41
  • 42
  • 43
  • 44
  • 45
  • …
  • 88
  • 89
  • 90

Recent Posts

  • Either a rebound or a breakout imminent on SILVER
  • GOLD Nível visado: 2976.3601
  • A potential bearish movement on GOLD
  • มีโอกาสเกิดการเคลื่อนตัวแบบ bearish บน GOLD
  • Posible gran movimiento en el AUDJPY

Recent Comments

    Translation


     Edit Translation

    Trade with

    a market leader you can rely on

    Open Trading Account Try a Free Demo

    Forex Trading

    • Accounts Overview
    • Open an Account
    • Launch Web Trader

    Trading Specifications

    • Spreads and Commissions
    • Range of Market
    • Trading Hours
    • Funding
    • Withdrawal

    About IC Markets

    • Help Center
    • Why IC Markets
    • Regulation
    • Legal Documents
    • Contact Us


    Forex Trading

    • Accounts Overview
    • Open an Account
    • Launch Web Trader

    Trading Specifications

    • Spreads and Commissions
    • Range of Market
    • Trading Hours
    • Funding
    • Withdrawal

    About IC Markets

    • Chat with a Specialist 24/7
    • Why IC Markets
    • Regulation
    • Legal Documents
    • Contact Us

    Disclaimer: This material is marketing material where all marketing material is published for informational purposes only. This material does not contain and should not be considered as containing - investment advice and recommendations, or suggestions for performing any actions with financial instruments. The built-in widgets belong to their external independent authors, and IC Markets is not responsible for their content and their impact on trade.

    All content rights reserved. Opinions of the authors may not coincide with the opinion of the blog editors. When copying materials from this site or connecting to an RSS feed to republish our articles, a link to IC Markets or attribution in the format ‘IC Markets Blog’ is required. For general questions, please contact the editorial office via the form on the Contact us page.

    Risk Warning: Trading Derivatives carries a high level of risk to your capital and you should only trade with money you can afford to lose. Trading Derivatives may not be suitable for all investors, so please ensure that you fully understand the risks involved and seek independent advice if necessary. A Product Disclosure Statement (PDS) should be considered before entering into a transaction with us.

    The contents of this page are general information only and does not take into account your personal situation, financial objectives or needs. It is up to you to make sure the products that we offer suit your specific needs. You should not trade with us unless you understand the features and risks of the products that we offer. This means that you might need to seek independent advice before you start trading with us.

    © 2022 Raw Trading Ltd | All rights reserved.
    • Sample Page